If you run a business or manage an online store, knowing your gross margin is essential. It tells you how efficiently your business turns sales into profit. And if you’re using Excel, calculating your gross margin becomes quick and repeatable once you know the right formula.
Let’s walk through how to do it step-by-step.
1. What Is Gross Margin and Why It Matters
Gross margin measures how much profit you make after subtracting the cost of goods sold (COGS) from your total revenue. It’s usually shown as a percentage.
Here’s the basic idea:
Gross Margin (%) = (Revenue – Cost of Goods Sold) ÷ Revenue × 100
So, if you earn £10,000 in sales and your COGS is £6,000, your gross margin is 40%.
That number shows how much money you’re keeping from each sale before expenses like rent, salaries, or marketing.
2. The Gross Margin Formula in Excel
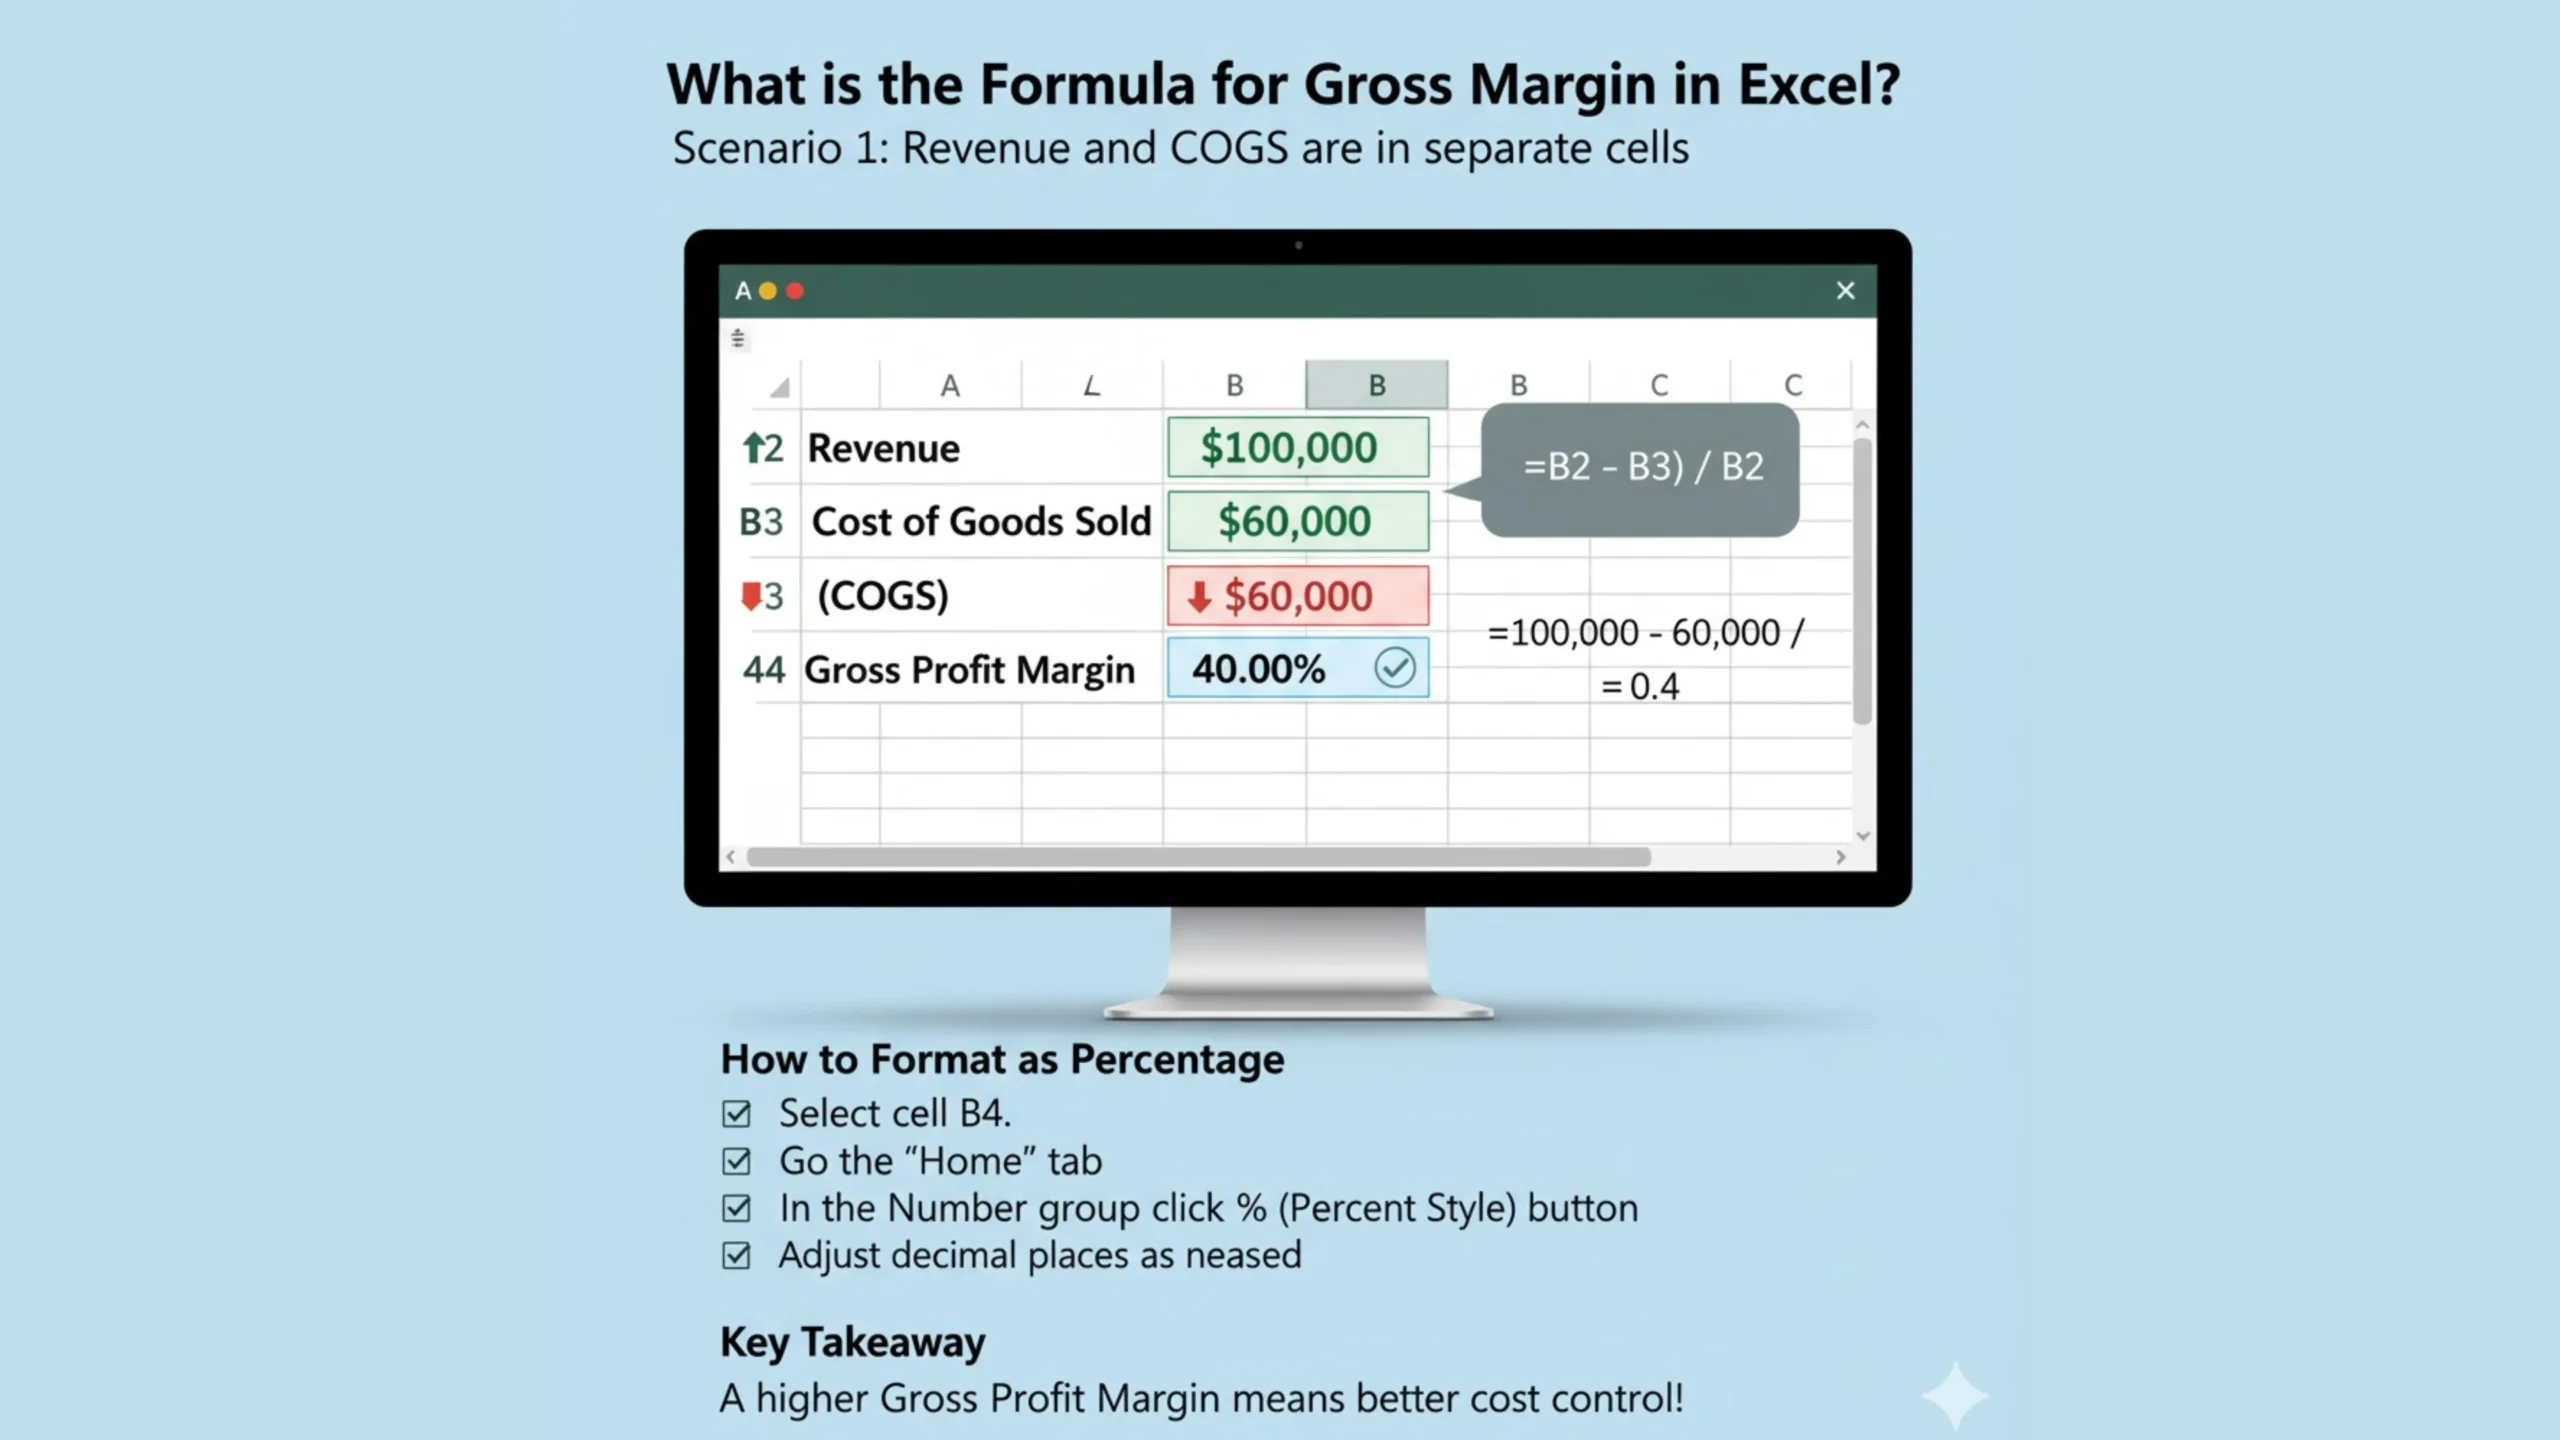
In Excel, you can calculate it easily with this formula:
=(A2 - B2) / A2
- A2 = Total Revenue
- B2 = Cost of Goods Sold
To display it as a percentage, simply select the cell and choose Percentage Format (%) in Excel’s toolbar.
Example:
If A2 = 10,000 and B2 = 6,000, the result is 0.4 → shown as 40% after formatting.
3. How to Build a Gross Margin Calculator in Excel
Here’s how to set up your own Excel profit margin calculator:
| A | B | C | D |
|---|---|---|---|
| Product | Revenue | COGS | Gross Margin (%) |
| Product A | 10,000 | 6,000 | =(B2-C2)/B2 |
You can drag the formula down for all your products.
Now you’ve got a full gross margin report inside Excel — simple, clean, and reusable.
If you manage a Shopify or eCommerce store, export your sales data and drop it into this sheet to instantly see your profit margins by product.
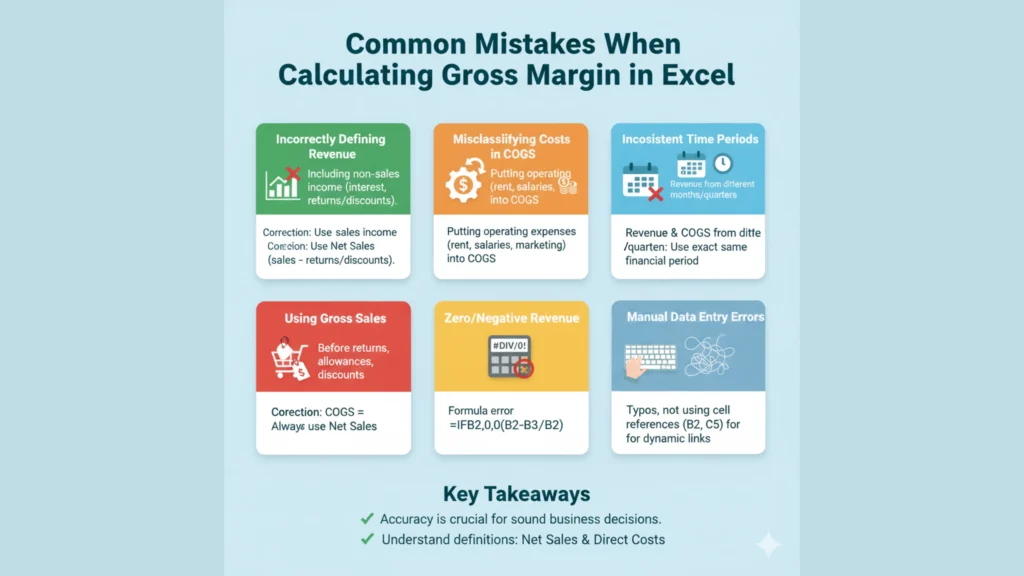
4. Common Mistakes When Calculating Gross Margin in Excel

A few things often trip people up:
- Mixing up profit and margin – Profit is revenue minus cost, but margin is the percentage of that profit compared to revenue.
- Forgetting to use parentheses – Excel reads formulas left to right, so always use brackets like
(A2-B2)/A2. - Not formatting as a percentage – Otherwise, Excel might show “0.4” instead of “40%.”
These small errors can throw off your financial analysis.
5. Why Using Excel for Margin Tracking Helps Your Business
Excel isn’t just for basic math. When you use it for gross margin analysis, you can:
- Track performance across different products or months
- Compare costs and selling prices quickly
- Forecast how pricing changes affect your profit margins
If you’re running an online business, this visibility can help you spot low-margin products and focus on what’s actually profitable.
Final Thoughts
The gross margin formula in Excel is simple — but powerful:
=(Revenue – COGS) / Revenue
Once you understand it, you can analyze profit margins for every product, campaign, or sales channel with just a few clicks. Whether you’re an eCommerce seller or a small business owner, this one formula can tell you more about your business health than any long report ever could.


